Sunlight to Electricity: Navigating the Field
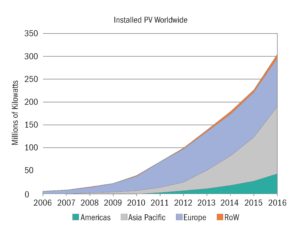
Solar power plant capacity increased fifty-fold between 2006 and 2016, dominated first by expansion in Europe then in Asia (Figure 1). Comparatively, the Americas have been small players. Looking ahead, it is possible that solar power will become a primary contributor to the world’s electric power system by mid-century, but there is still a long way to go. In 2016, about 1.5 percent of total global electricity came from solar power. In the U.S. the percentage was about the same.
We have identified five open questions whose answers will shape the future of solar power:
Below, each of these questions is elaborated, followed by a discussion of the likely path forward.
Will distributed and centralized deployment both flourish?
Solar cell technology is spectacularly modular: essentially identical solar panels are deployed on rooftops and multi-thousand-acre fields. Due to this modularity, the plummeting costs of solar cell technology have contributed to solar power’s growth at all scales.
Here, we distinguish utility projects (which deliver all power directly to an electric utility) from distributed generation projects (where some or all of the produced electricity is consumed on site). Distributed generation projects are either residential projects (a widely used billing category) or mid-scale projects. Mid-scale projects include commercial projects on private property (another billing category), such as installations on the flat roofs of warehouses. Mid-scale projects also include projects on public land – on or near schools, hospitals, parks, municipal centers, and parking structures. Mid-scale projects get less attention, but they actually dominate distributed generation in some areas. In New Jersey, the total capacity of mid-scale projects is 2.5 times the total capacity of residential projects, even though residential projects are almost ten times as numerous.
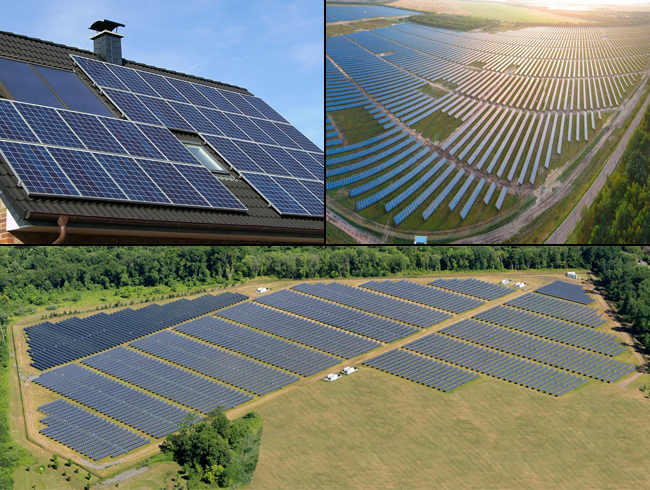
Residential and utility projects have recognizable archetypes, seen in the upper left and right photographs of Figure 2. Mid-scale projects, like Princeton University’s project (bottom), by contrast, are rarely included in the visual imagery of solar power.
The merits of distributed generation are disputed. Proponents see intrinsic value in how distributed generation affirms self-reliance and self-sufficiency for households and communities. They see competition fostered and innovation stimulated. They emphasize that distributed storage will soon be twinned with distributed generation, jointly relieving grid bottlenecks and providing resilience. On the other side, proponents of centralized generation note its low cost. Implicitly, they see intrinsic value in how it creates mutual dependency and enables the few with special skills to free the many to pay attention to other things. Proponents of centralized generation also argue that a single owner will be a better optimizer of the whole system. Similar arguments against and for centralization permeate debates about the distribution of food, water, wastes, and information.
Looking ahead: Future deployment could tilt toward very large projects, given their substantially lower construction costs for the same amount of electricity generated. On the other hand, residential and mid-scale projects by the millions may also flourish – especially if distributed electricity storage prospers too, and if, together, they make the grid more flexible and more robust. If deep penetration of distributed solar generation into electricity markets is achieved, political support for pro-solar policy will strengthen, to the likely benefit of centralized solar power as well.
How much can balance-of-system costs be reduced?
Historically, the primary approach to reducing solar power costs was to lower the production costs of the panels. These production costs have plummeted in recent years, and attention has shifted towards lowering the cost of the “balance of system” — that is, everything except the panels. The balance of system, which differs from project to project, includes the inverter (which converts the direct current produced at the panel into the alternating current required by the grid and most appliances), all other hardware, labor for installation, and non-labor “soft costs” (customer acquisition, land, permitting, interconnection, financing, taxes, and profit).
Figure 3 shows panel costs and balance-of-system costs for 2009 through 2016 for a representative residential, commercial, and utility project. Total costs fell by more than half in all cases. Mostly, module costs fell faster than balance-of-system costs.
Looking ahead: Pressure to reduce balance-of-system costs will continue to be intense, because these costs now determine a project’s competitiveness. Balance-of-system costs fall when panel conversion efficiency increases. Other routes to lower costs vary in importance. They include standardization of hardware, integration with other infrastructure, workforce training, simplification of permitting, and financial risk management.
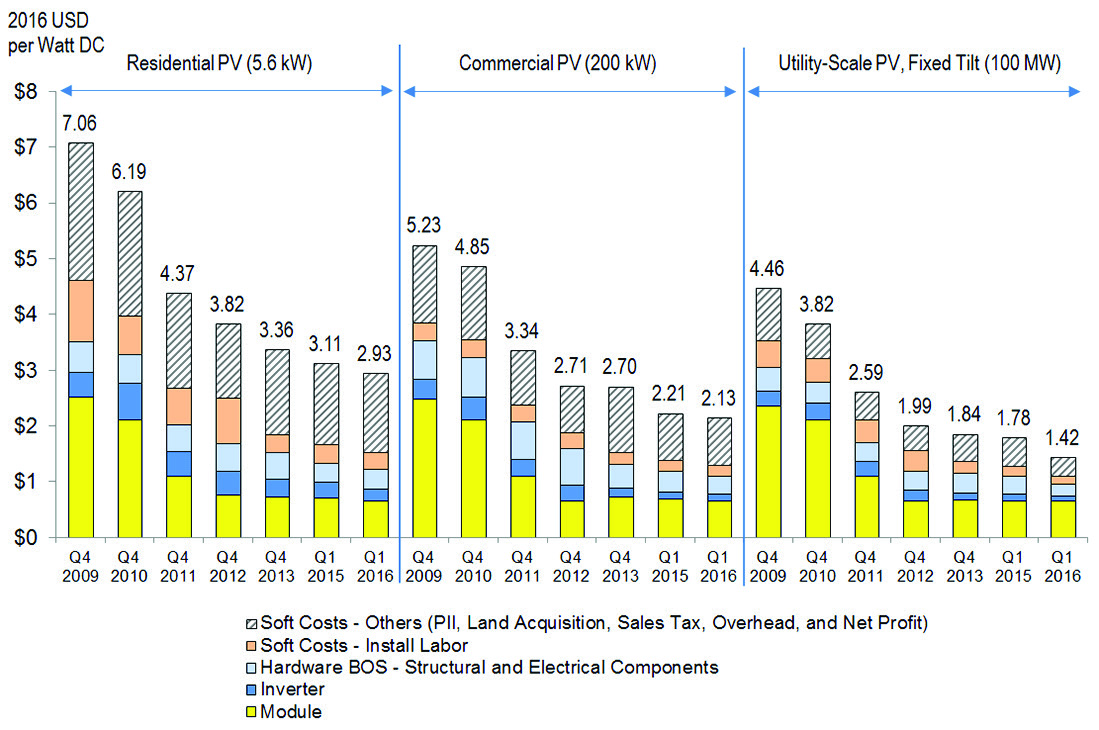
Figure 3: Costs for representative residential, commercial, and utility solar projects, as modeled by the National Renewable Energy Lab (NREL). Q1 and Q4 are a year’s first and fourth quarters, respectively. PII is “Permitting, Inspection, and Interconnection.” BOS is “Balance of System.” Source: NREL, “NREL report shows U.S. solar photovoltaic costs continuing to fall in 2016.” http:// www.nrel.gov/news/ press/2016/37745.
Will crystalline silicon remain the workhorse of solar power?
Today, the crystalline silicon module has 90 percent of the solar module market. Figure 4 tracks its average sales price, per unit of capacity, from 1976 to 2016. The price per peak-watt fell from $100 to about 40 cents per peak-watt, while cumulative production increased by a factor of one million. This rapid and prolonged price decline was enabled by steady improvements in efficiency throughout the supply chain, research and development, and spillover of positive results achieved by other industries. Most of the remaining ten percent of the module market is held by the thin-film cadmium telluride module, which began to prosper during the decade from 2001 to 2010, when there was a spike in the cost of silicon (seen in Figure 4).
Will the cadmium telluride cell or any emergent thin-film cell challenge crystalline silicon’s dominance, now that the silicon cell industry has developed so much infrastructure and experience?
Looking ahead: A limitation of the crystalline silicon solar cell is its availability (thus far) only as a rigid structure, which limits potential uses. Its many thin-film competitors will be more versatile, and some will occupy at least niche markets (such as roofing shingles and other building components), even if they do not become workhorses for electricity production. To compete with crystalline silicon as an electricity provider, a thin-film solar cell will need to convert sunlight to electricity at substantially higher efficiency than the crystalline silicon cell, demonstrate stability and ease of manufacture, and avoid scarce or toxic materials. Meanwhile, the silicon solar cell may become an even more formidable competitor, if its conversion efficiency improves with the help of a thin-film cell with complementary absorption in a tandem configuration.
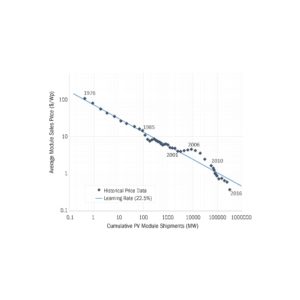
Figure 4: The average price for a panel with crystalline silicon cells (in units of 2016 U.S. dollars per peak-watt, $/Wp) versus global cumulative capacity of panel shipments (in units of thousands of kilowatts, or megawatts, MW), 1976- 2016. The straight line represents a learning rate (LR in the figure) where the price falls by 22.5 percent for each doubling of cumulative production. The data extend across 20 doublings of cumulative production. Source: International Technology Roadmap for Photovoltaic, Eighth Edition, March 2017, Figure 3: http://www.itrpv. net/Reports/Downloads/
Will solar power subsidies disappear?
Government policies favorable to solar electricity are called “incentives” by their proponents and “subsidies” by their detractors. The principal federal government policy in the U.S. is the Investment Tax Credit, which is a deduction on an individual’s or a company’s tax return, currently 30 percent of the project cost. Depreciation rules governing solar projects are also favorable, currently roughly as valuable to a private company as the Investment Tax Credit.
Many U.S. states have further incentivized solar power by requiring every supplier of retail electricity operating in the state to produce some minimum fraction of its electricity from prescribed renewable energy sources, or else to buy from others what it cannot produce itself. States can also require “net metering,” which values equally the electricity transmitted from the customer to the electric utility and from the utility to the customer. Thereby, the utility is forced to buy a customer’s solar power at a retail price, while it buys from other sources at a lower, wholesale price.
The societal impact of policy incentives for solar power was modest when there were only a few beneficiaries – the “early adopters.” But as solar power’s market share increases, some utilities and consumer advocates are pushing back. They argue that “non-adopter” taxpayers and ratepayers are paying for the subsidies enjoyed by the early adopters, who are mostly wealthy people. They warn that a shrinking customer base will undermine the utility’s historic function of maintaining grid reliability.
Looking ahead: Governments incentivize solar power for two principal reasons: to enable high-volume production that leads to competitive power and to recognize unpriced environmental and national security benefits. There will be downward pressure on future subsidies as the transition to competitiveness progresses. A case in point is the Investment Tax Credit in the U.S., now scheduled for phase-out (for residential projects, the deduction remains at 30 percent until 2020 and then falls to zero after 2023). There may be upward pressure at all scales, as evidence for climate change becomes increasingly compelling. Via subsidies or grid market reform, distributed solar power may also be compensated for any strengthening of system resilience. The balance of pressures is likely to assure at least a floor on incentives.
Will the intermittency of solar power soon throttle its expansion?
The full costs of a solar project include not just the project costs for panels and balance of system, but also the costs borne by the electricity grid so that grid power remains “dispatchable,” i.e., available on demand. Grid regulators and operators, who were able to cope with intermittency and unpredictability when solar power’s market share was tiny, are now confronting problems of oversupply at mid-day, as well as rapid output climbs in the morning and descents in the evening.
A common but misleading target for solar power, “grid parity,” neglects these system-level costs of intermittency. Grid parity, nominally, is achieved when a kilowatt-hour of solar electricity costs no more than a kilowatt-hour of electricity produced from, say, natural gas or coal. What is usually being compared is the “levelized cost of electricity,” which is the total cost for building and operating a power-generating facility, divided by the amount of electricity the facility produces over its lifetime, with no reference to when the power is produced. A target that encompasses intermittency is difficult to devise, especially because grid integration costs depend on what else is on the grid already.
Looking ahead: The adverse consequences of intermittency can be alleviated, at least partially, in many ways. The grid can be made more flexible by reducing the fraction of electricity from nuclear and coal power plants, which function best when running at a constant rate, in favor of hydropower and gas-turbine power, whose output can be varied rapidly. The grid can be extended geographically to integrate distant sources that have complementary time profiles. Banks of batteries, both centralized and at building-scale, can be charged at times of excess electricity supply and discharged when supply is deficient. At times of excess, hot water and cold water (or ice) can be produced and stored in a building to provide desired temperatures hours later.
Each of these strategies can be incentivized by “time-of-use” billing rates that make electricity less expensive when supply is abundant. Some stationary solar collectors in the northern hemisphere will then be reoriented southwest instead of due south, to shift peak output from noon to a few hours later. People will become more aware of whether a day is sunny or cloudy as they find themselves running their washing machine (and, perhaps, charging their electric-car battery) preferentially at mid-day on sunny days.
Summing up
One should not be surprised to see further rapid gains in solar power’s market share (both globally and in the U.S.), and centralized power growing faster than distributed power. Crystalline silicon cells are likely to continue to dominate all competitors. Concern for climate change and other geopolitical, environmental, and public health risks will
prolong the subsidies that lower the cost of electricity from the sun relative to electricity from fossil fuels. Solar power’s daily variability and the variability due to clouds will drive preferential use of natural gas for flexible power, time-responsive energy consumption, and novel combinations of local and centralized energy storage.
CONTRIBUTORS
Barry Rand

Barry Rand is an assistant professor in the Department of Electrical Engineering and Andlinger Center for Energy and the Environment at Princeton University. Prof. Rand’s research interests highlight the border between electrical engineering, materials science, chemistry, and applied physics, covering electronic and optoelectronic thin-films and devices. Barry Rand earned a BE in electrical engineering from The Cooper Union in 2001, and his PhD in electrical engineering from Princeton University in 2007. He worked at imec in Leuven, Belgium, prior to joining the faculty at Princeton. He has authored more than 90 refereed journal publications, has 19 issued US patents, and has received awards including the 3M Nontenured Faculty Award, DuPont Young Professor Award, DARPA Young Faculty Award, and ONR Young Investigator Program Award.
Disclosure
Disclosed research funding, consulting, and board memberships in the energy sector over the past five years and current financial interests in the energy sector as of August 2017.
Nothing to disclose.


 Manali Gokhale graduated cum laude from Princeton University in 2016 with a BSE in Chemical and Biological Engineering and certificates in the Sustainable Energy and Materials Science and Engineering programs. For her senior thesis, she worked in Prof. Bruce Koel’s lab exploring catalytic materials for the oxygen evolution reaction in energy storage applications. She previously worked at SunEdison as part of their solar module R&D team, developing new module designs and improving module conversion efficiency. While at Princeton, Manali also held leadership roles with Outdoor Action and the Pace Center’s Breakout alternative breaks program. She currently lives in Washington, DC and works as an analyst for DC Energy, furthering her interest in the power grid.
 Samantha Walter recently graduated from Princeton with a bachelor’s degree in Chemical and Biological Engineering and with a certificate in Environmental Studies. While at Princeton, she worked on several energy related research projects including her thesis which was on visualizing the dynamics of the electricity grid through diffusion maps, a data reduction tool. The summer before her senior year, she interned for Chairman LaFleur at the Federal Energy Regulatory Agency and also did some work with the data analytics team. She is currently working as a client services associate at PowerAdvocate in San Francisco.
ACKNOWLEDGEMENTS
Ted Borer was a valuable guide to the Princeton University case study. William Hackett, Anne Hoskins, Benjamin Scott Hunter, Ralph Izzo, Tom Kreutz, Tom Leyden, Andrew Mills, and Michael Winka provided insights into enabling policy and commercialization. We benefited from the summer research of three Princeton undergraduates: Angelo Campus, Lindsey Conlan, and Isabella Douglas.
An intermediate version of this report was critiqued by the eight graduate students in a Policy Workshop at Princeton University on community solar power taught by Anne Hoskins and Jeanne Fox. Stephen Lassiter, one of these students, judiciously combined his comments with the others – from Vivian Chang, Cara Goldenberg, Jack Hoskins, Zhongshu Li, Eri Nakatani, Sheree Oluwafemi, and Hannah Safford.
We also benefited from comments on early drafts from Emily Carter, Philip Chew, Phillip Hannam, David Kanter, Elena Krieger, Eric Larson, Nicolas Lefevre, and Sigurd Wagner. A late draft was helpfully reviewed by Joe Berry, Michael McGehee, Cliff Rechtschaffen, Lenny Tinker, and Jessika Trancik.
The production of this report was guided diligently and creatively by Nari Baughman, Darcy Cotten, Joel Oullette, and Jennifer Poacelli.
At every stage, our revisions were propelled by Lynn Loo’s commitment to clear and effective communication.
The Andlinger Center for Energy and the Environment is grateful to the High Meadows Foundation, the Nicholas Family, and an anonymous donor whose gifts are helping to advance public understanding of critical issues related to energy and the environment through this Energy Technology Distillate.